

If you find the content useful and wish to support our platform’s development, you can contribute any amount toward our production costs. Scan the UPI QR code for payment within India. Or use the Ko-fi link to process a secure payment via PayPal.
If you find the content useful and wish to support our platform’s development, you can contribute any amount toward our production costs. Scan the UPI QR code for payment within India. Or use the Ko-fi link to process a secure payment via PayPal.
Statistics is often described as the science of data, but in today's digital world it is much more than that. Every recommendation you receive on a streaming platform, every fraud alert generated by your bank, every weather forecast, and every modern Artificial Intelligence (AI) application relies on statistical principles. Before an AI model can recognize faces, translate languages, recommend products, or predict diseases, the underlying data must first be collected, organized, explored, and understood. Statistics provides the language and the tools that make this possible.
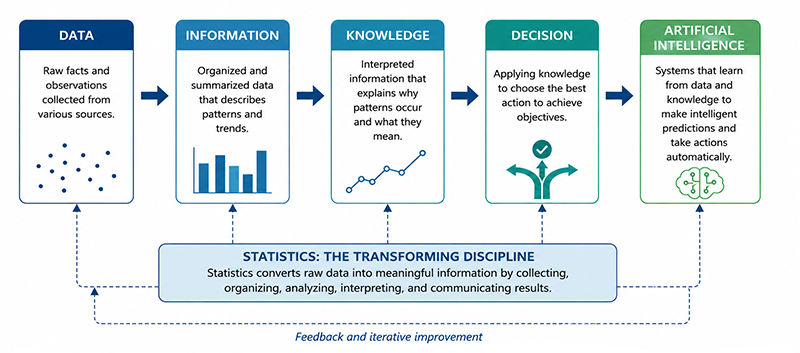
As illustrated in Figure 1.0, statistics transforms raw data into meaningful information that ultimately supports intelligent decision-making.
For many learners, statistics is associated with formulas and calculations. While mathematical computation is certainly an important part of the subject, statistics is fundamentally about understanding information and making better decisions. Rather than memorizing formulas, this course emphasizes developing statistical thinking—learning how to ask questions about data, recognize patterns, interpret evidence, and communicate findings accurately.
One of the distinguishing features of this LearnerBox course is its emphasis on Artificial Intelligence and Data Analytics. Instead of treating statistics as an isolated subject, every major concept will be connected to practical applications in AI, Machine Learning, business analytics, or scientific research.
Unlike many introductory textbooks that use unrelated examples in each chapter, this course adopts a progressive dataset approach. Throughout the six modules, you will repeatedly analyze a small collection of carefully designed datasets. Each module introduces new statistical techniques while building upon the datasets and concepts encountered previously.
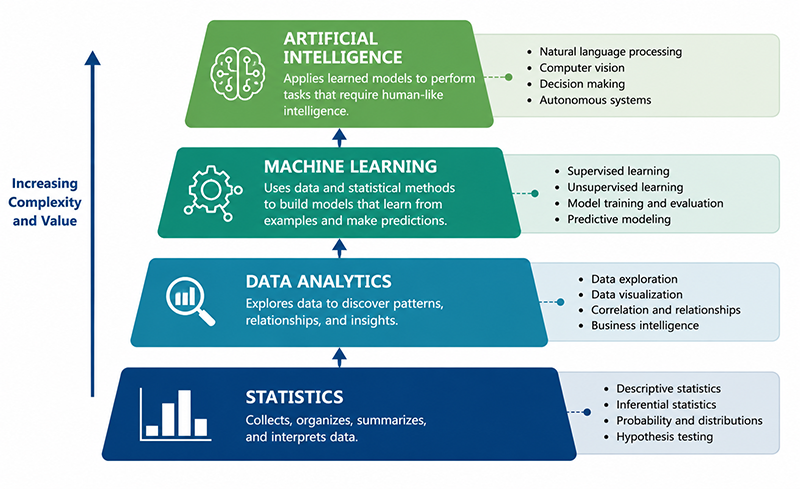
As shown in Figure 1.1, statistics forms the foundation of the modern AI ecosystem.By the end of this module, you will understand the vocabulary of statistics, distinguish different types of data, identify variables and observations within datasets, differentiate between populations and samples, and gain your first experience working with datasets similar to those used in modern AI systems.
After completing this module, you should be able to:
We are living in an era where decisions are increasingly driven by data. Businesses analyze customer behavior to improve products, hospitals study patient records to improve healthcare outcomes, governments evaluate census information to plan public services, and researchers investigate scientific data to answer important questions.
The rise of Artificial Intelligence has made statistical literacy even more important. Machine learning algorithms do not create knowledge from nothing; they learn patterns from data. If the data are inaccurate, biased, incomplete, or poorly understood, the resulting AI system will also perform poorly.
Statistics is the scientific discipline concerned with learning from data. It provides a systematic process for collecting, organizing, summarizing, analyzing, interpreting, and presenting information so that meaningful conclusions can be drawn. Although statistics originated as a tool for governments to record information about populations, it has evolved into one of the most important disciplines supporting modern science, business, engineering, medicine, and Artificial Intelligence.
In everyday life, we constantly encounter statistical information. Weather forecasts estimate the probability of rain, hospitals compare treatment outcomes, businesses analyze customer purchasing patterns, and governments monitor unemployment rates. Behind each of these activities lies the collection and analysis of data.
Statistics is therefore much more than computation. It is a way of thinking about evidence. A good statistician asks questions such as:
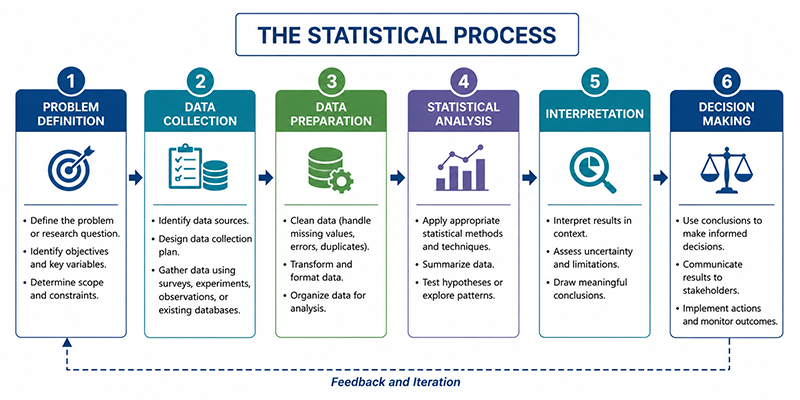
As illustrated in Figure 1.2, statistics is best viewed as a complete problem-solving process rather than a collection of isolated techniques. Every statistical investigation begins by clearly defining the problem to be solved. Data are then collected, organized, and analyzed using appropriate methods before the results are interpreted in their proper context. Only after these steps have been completed can reliable conclusions be communicated to support informed decision-making. Statistical thinking emphasizes evidence rather than assumptions. Decisions based on carefully analyzed data are generally more reliable than decisions based solely on intuition or personal experience.
These six steps form the foundation of almost every data analysis project. As you progress through this course, you will repeatedly follow this same workflow while analyzing progressively richer datasets.
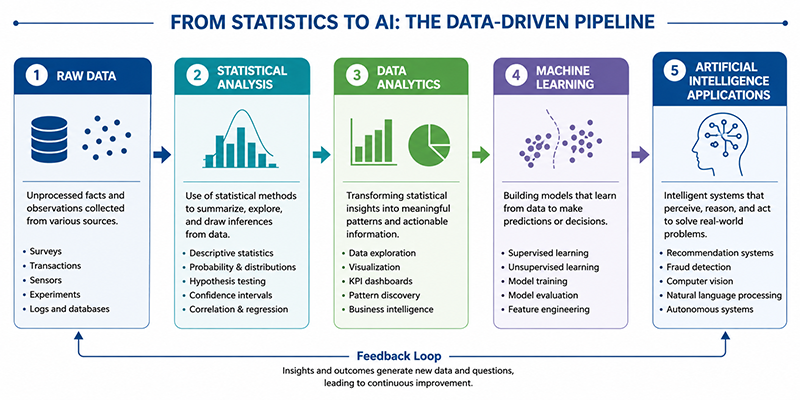
Artificial Intelligence systems learn from data. Before an AI model is trained, data scientists must understand the quality and characteristics of the available data. This initial exploration relies heavily on statistical methods.
For example:
In each case, statistics helps answer important questions before any machine learning algorithm is developed.
A university wishes to determine whether first-year students are spending sufficient time studying each week. Before collecting any data, the researchers formulate the following question:
"How many hours do first-year students study during a typical week?"
Identify the first three steps of the statistical process.
Solution
Interpretation
At this stage, no calculations have been performed. Statistics begins with asking a clear question and collecting appropriate data.
Statistics is traditionally divided into two major branches: Descriptive Statistics and Inferential Statistics. Although they are closely related, they serve different purposes. Descriptive statistics focuses on summarizing and presenting the information contained within a dataset, whereas inferential statistics uses information obtained from a sample to draw conclusions about a larger population.
Understanding the distinction between these two branches is essential because every statistical investigation begins with description before progressing to inference.
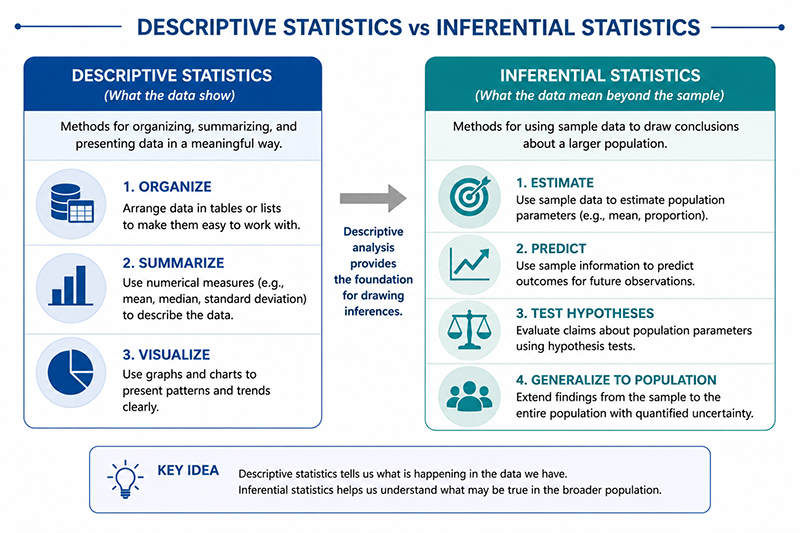
As shown in Figure 1.4, descriptive statistics and inferential statistics complement one another. A data analyst first explores and summarizes the available data before making conclusions or predictions about a wider population.
Common descriptive statistical techniques include:
Notice that descriptive statistics only describes the data that have already been collected. It does not attempt to make predictions about observations outside the dataset.
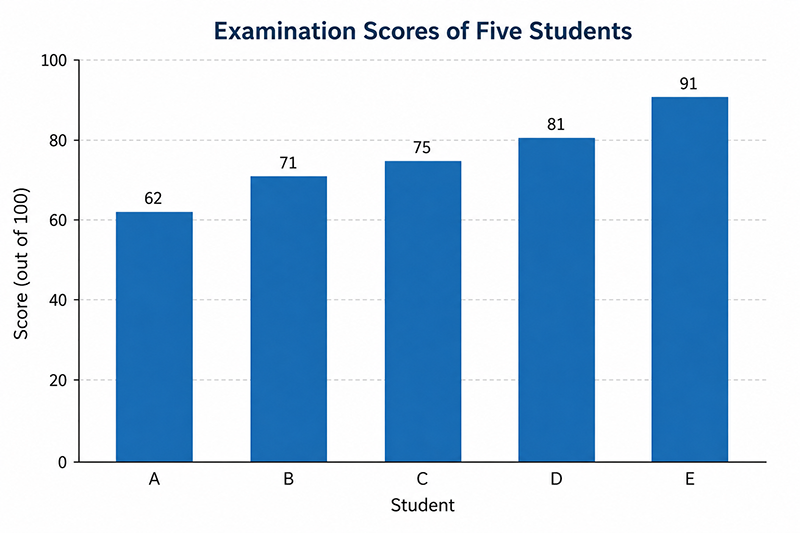
A lecturer records the examination scores of five students.
| Student | Score |
|---|---|
| A | 62 |
| B | 71 |
| C | 75 |
| D | 81 |
| E | 91 |
Question
Is this an example of descriptive or inferential statistics?
Solution
The table summarizes the scores of the five students who were observed. No conclusions are made about any other students.
Interpretation
This is an example of descriptive statistics because it summarizes the available data only.
Examples include:
Inference always involves some degree of uncertainty because conclusions are drawn from a sample rather than the entire population.
A university has 18,000 students. Researchers randomly select 400 students and calculate that the average study time is 9.2 hours per week.
They conclude that the average study time of all university students is approximately 9.2 hours per week.
Question
Is this descriptive or inferential statistics?
Solution
The conclusion extends beyond the 400 students who were observed. The researchers are using a sample to estimate the characteristics of the entire university population.
Interpretation
This is an example of inferential statistics.
As you progress through the course, you will discover that every statistical investigation combines both description and inference to transform data into meaningful knowledge.
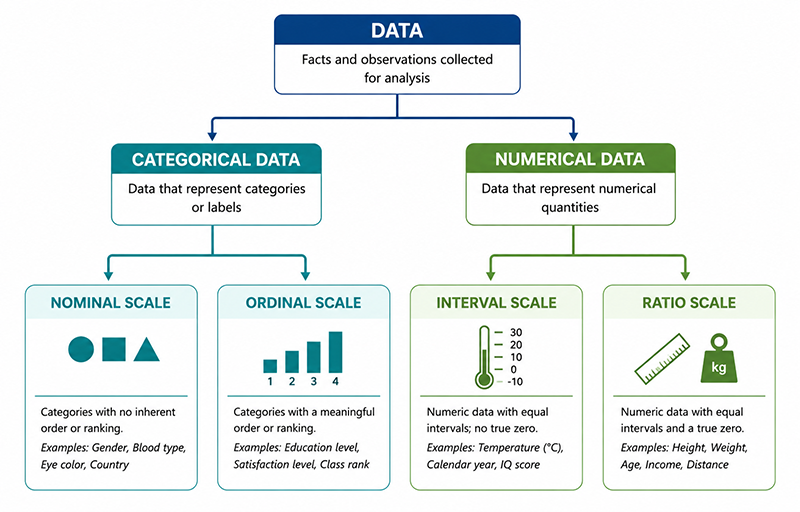
Before selecting an appropriate statistical method, it is essential to understand the type of data being analyzed. Different types of data require different methods of organization, visualization, analysis, and interpretation. Choosing an inappropriate statistical technique can lead to misleading or incorrect conclusions.
As shown throughout this course, understanding data begins long before performing calculations. A data analyst must first identify the nature of each variable and determine how it should be measured.
Examples include:
Examples:
A company records the following variable for each customer:
| Customer | Browser |
|---|---|
| C1 | Chrome |
| C2 | Edge |
| C3 | Firefox |
| C4 | Chrome |
| C5 | Safari |
Question
Identify the type of variable.
Solution
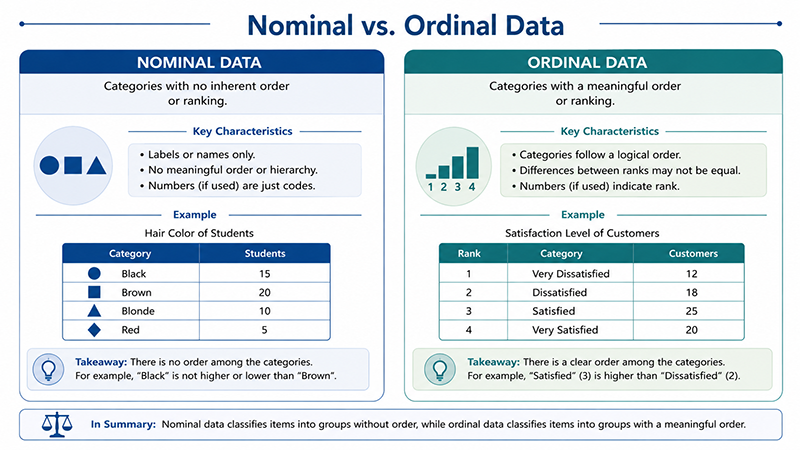
The values represent names of browser categories. There is no meaningful ranking among Chrome, Edge, Firefox, and Safari.
Interpretation
The variable is measured on a nominal scale.
Examples include:
Examples include:
The most common example is temperature measured in degrees Celsius or Fahrenheit.
For example, a temperature of 20°C is not twice as hot as 10°C because the zero point is arbitrary.
The temperatures recorded over five days are:
| Day | Temperature (°C) |
|---|---|
| Mon | 24 |
| Tue | 27 |
| Wed | 25 |
| Thu | 29 |
| Fri | 30 |
Question
What measurement scale is used?
Solution
Temperature measured in degrees Celsius has equal intervals but no true zero.
Interpretation
This variable is measured on an interval scale.
Examples include:
As shown in Figure 1.6, identifying the correct data type is the first step before choosing graphs, summary statistics, or inferential procedures. Throughout the remaining modules, you will repeatedly classify variables before analyzing them using statistical methods.
Every statistical investigation begins with data, but data are meaningful only when we understand what each value represents. Two of the most important concepts in statistics are the variable and the observation. These terms appear throughout statistics, data analytics, machine learning, and research, making it essential to understand them thoroughly before moving to more advanced topics.
A variable is any characteristic or property that can assume different values from one observation to another. Variables allow us to measure, describe, and compare individuals, objects, or events.
Examples of variables include:
An observation is a single unit from which information is collected. Depending on the study, an observation may represent a person, a company, a product, a patient, a country, or even a single transaction.
Consider the following dataset.
| Student | Age | Study Hours | Mathematics Score |
|---|---|---|---|
| A | 18 | 4 | 68 |
| B | 19 | 6 | 75 |
| C | 20 | 8 | 83 |
| D | 18 | 5 | 72 |
| E | 21 | 9 | 91 |
Question
Identify:
Solution
Interpretation
The observations represent the entities being studied, while the variables describe measurable characteristics of those entities.
For example, if we wish to predict a student's final examination score, variables such as age, attendance, and study hours become features that are supplied to a machine learning algorithm.
Many statistical investigations seek to understand whether one variable influences another.
The variable that is believed to explain or predict another variable is called the independent variable. The outcome being measured is called the dependent variable.
Examples include:
| Investigation | Independent Variable | Dependent Variable |
|---|---|---|
| Student performance | Study hours | Examination score |
| House prices | House size | Selling price |
| Advertising | Advertising expenditure | Sales revenue |
| Agriculture | Rainfall | Crop yield |
Notice that the independent variable is not necessarily the cause of the dependent variable. Statistics identifies relationships, while establishing causation usually requires carefully designed experiments.
A researcher wishes to determine whether increasing study time is associated with higher examination scores.
Question
Identify the independent and dependent variables.
Solution
Interpretation
The researcher believes that changes in study hours may help explain differences in examination scores. In later modules, this relationship will be examined using correlation and linear regression techniques.
One of the central ideas in statistics is that it is often impractical, expensive, or even impossible to collect information from every member of a group. Instead, statisticians collect data from a smaller subset and use that information to understand the larger group.
A population is the complete collection of individuals, objects, or events that satisfy the conditions of a study. A sample is a subset of the population selected for analysis.
A city contains 52,000 households. A researcher surveys 650 households to estimate the average monthly electricity consumption.
Question
Identify the population and the sample.
Solution
Interpretation
The researcher hopes that the sample represents the larger population. Later modules will explain how sampling methods influence the reliability of statistical conclusions.
However, sampling introduces uncertainty. Two different samples drawn from the same population are unlikely to be identical, which is why inferential statistics is needed.
A representative sample reflects the important characteristics of the population from which it is drawn.
For example, if a university consists of undergraduate and postgraduate students, a sample containing only postgraduate students would not adequately represent the entire student population.
A researcher wants to estimate the average daily screen time of all university students.
Two sampling plans are proposed.
| Plan | Description |
|---|---|
| A | Survey 300 students from all faculties selected at random. |
| B | Survey 300 students from the Computer Science department only. |
Question
Which plan is more representative?
Solution
Plan A is more representative because students are selected from across the university rather than from a single department.
Interpretation
Representative samples reduce bias and improve the reliability of statistical conclusions.
Modern Artificial Intelligence systems are driven by data. Before any predictive model is trained, the available data must be collected, organized, explored, and understood. This process begins with a well-structured dataset.
A dataset is an organized collection of observations and variables. Throughout this course, datasets will become progressively richer as new statistical concepts are introduced.
| Student ID | Age | Study Hours | Attendance (%) | Quiz Score | Final Score |
|---|---|---|---|---|---|
| LB001 | 18 | 4 | 82 | 64 | 68 |
| LB002 | 19 | 6 | 91 | 75 | 79 |
| LB003 | 20 | 8 | 96 | 84 | 88 |
| LB004 | 18 | 5 | 85 | 69 | 73 |
| LB005 | 21 | 9 | 98 | 92 | 95 |
Initially, this dataset will be used simply to identify variables, observations, and data types. In later modules, the same dataset will be summarized, visualized, analyzed, and modeled using increasingly sophisticated statistical techniques.
The following exercises are designed to reinforce the concepts introduced throughout this module. Unless otherwise stated, answers should be supported with appropriate reasoning.
| Student | Age | Study Hours | Final Score |
|---|---|---|---|
| A | 18 | 4 | 66 |
| B | 19 | 6 | 74 |
| C | 20 | 8 | 85 |
| D | 18 | 5 | 71 |
Answer the following questions.
In this module, you were introduced to the language and fundamental concepts of statistics. You learned that statistics is much more than performing calculations; it is a structured process for transforming data into meaningful information that supports evidence-based decision-making.
The module explained the two major branches of statistics: descriptive statistics, which summarizes observed data, and inferential statistics, which uses sample data to draw conclusions about a larger population. You also explored the different types of data, learned how variables and observations form the building blocks of a dataset, and distinguished between populations and samples.
Finally, you were introduced to the idea of AI datasets and the LearnerBox Student Learning Analytics Dataset, which will gradually evolve throughout the remaining modules as additional variables and analytical techniques are introduced.
Take a short Quiz and find your score. You can always come back to this page and go through the content again!